Slots Exposure Trends: What Max Exposure, Volatility & RTP Show
Recommended casinos
We analyzed how contemporary slot design is influencing risk and structure across the global market. Drawing on data from over 3,000 non-branded video slots first tracked from February 18, 2025, and examining approximately 1,800 titles each in the UK, Sweden, and Brazil, we concentrated on three core indicators: maximum exposure (the risk ceiling of a game), volatility (the frequency and magnitude of outcome swings), and RTP High (the highest published return setting). Our objective: to quantify emerging norms and outliers in new slot releases.
Exposure Concentrates Fast at the Top
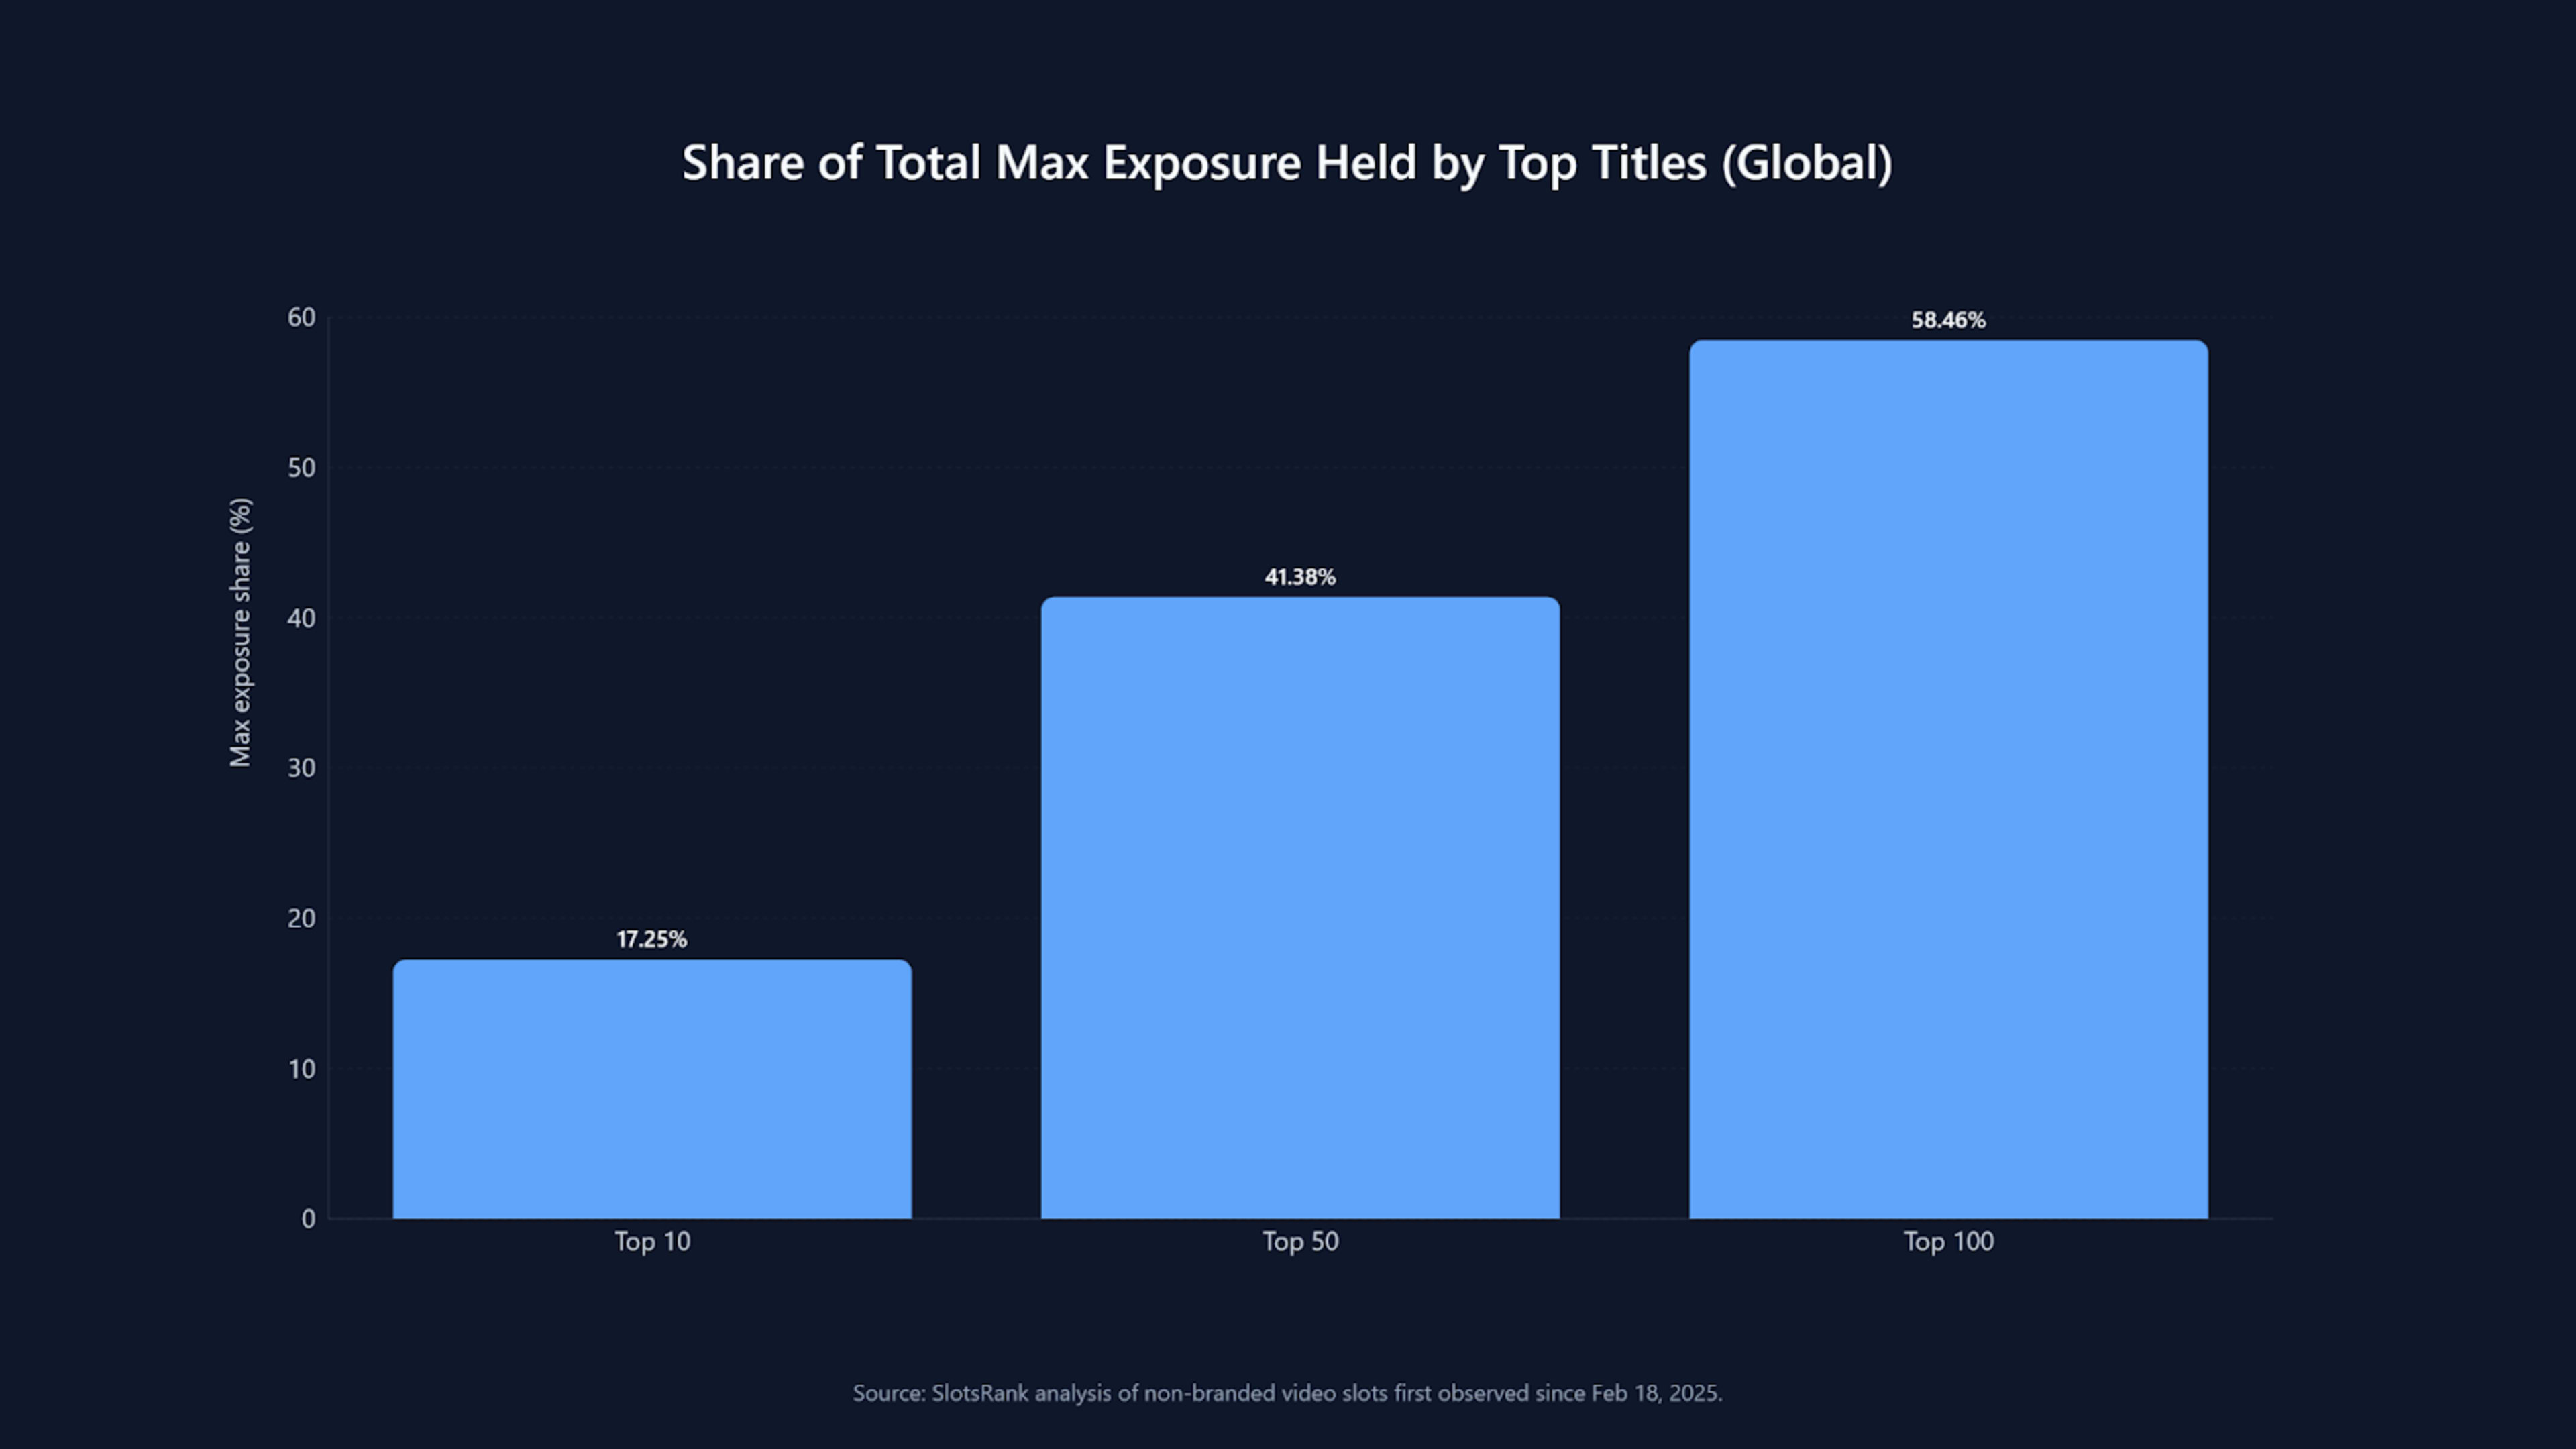
Ranking new non-branded slots by maximum exposure reveals a steep drop-off: the top 10 titles worldwide account for 17.25% of total exposure. Widening the scope, the top 50 account for 41.38%, and the top 100 for 58.46%. A small subset of releases, therefore, dominates the market’s overall risk ceiling.
This concentration reflects a winner-takes-most dynamic. These titles are not necessarily superior or more popular; rather, they occupy the extreme upper end of the exposure distribution, skewing it.
The disparity between typical and potential exposure is notable. The median maximum exposure stands at 25,000, while the highest observed value reaches 25,000,000. This spread highlights that most releases cluster near familiar exposure limits, but the market also produces rare outliers with vastly higher ceilings.
For context, high-exposure titles near the top of the global ranking include “Vegascaline” (Exco) and “Fortune Ace Super Scatter” (Pragmatic Play)—examples that illustrate the designs shaping the extreme end of the exposure curve.
UK, Europe, and LatAm: Same Exposure Pattern
We use three market snapshots—UK, Continental Europe (via Sweden), and Latin America (via Brazil)—to test the consistency of global trends. These countries do not represent their entire regions, but serve as practical case studies to assess whether similar exposure structures appear across distinct markets.
| Market snapshot | Titles reviewed | Top 10 share of max exposure | Top 50 share of max exposure | High-volatility share |
| UK | ~1,835 | 16.01% | 43.14% | 54.09% |
| Sweden (Europe snapshot) | ~1,763 | 15.72% | 43.91% | 53.41% |
| Brazil (LatAm snapshot) | ~1,853 | 13.89% | 40.41% | 55.49% |
Two patterns emerge. First, the concentration curve remains stable: in each snapshot, about 40%–44% of total maximum exposure is held by the top 50 titles. The “winner-takes-most” structure therefore persists within individual markets, not just globally.
Second, the prevalence of high volatility is consistent across regions. While the proportions fluctuate slightly, high-volatility titles remain the dominant profile among those with volatility data.
The UK snapshot offers concrete examples of well-known titles near the top of the exposure table, illustrating the high-ceiling tail without resorting to a “top picks” list. Notable entries include “Super Tiki Strike” (Pragmatic Play), “Rust World” (Peter And Sons), and Nolimit City’s “Brute Force Alien Onslaught.”
Volatility Skews High in New Releases
Volatility describes how a slot performs over time, essentially measuring the frequency and magnitude of outcome swings. Low-volatility games offer smaller, more frequent wins, while high-volatility titles feature longer quiet periods interrupted by larger payouts. Volatility is not an indicator of quality or profitability, but rather a design choice that influences the pace and distribution of results.
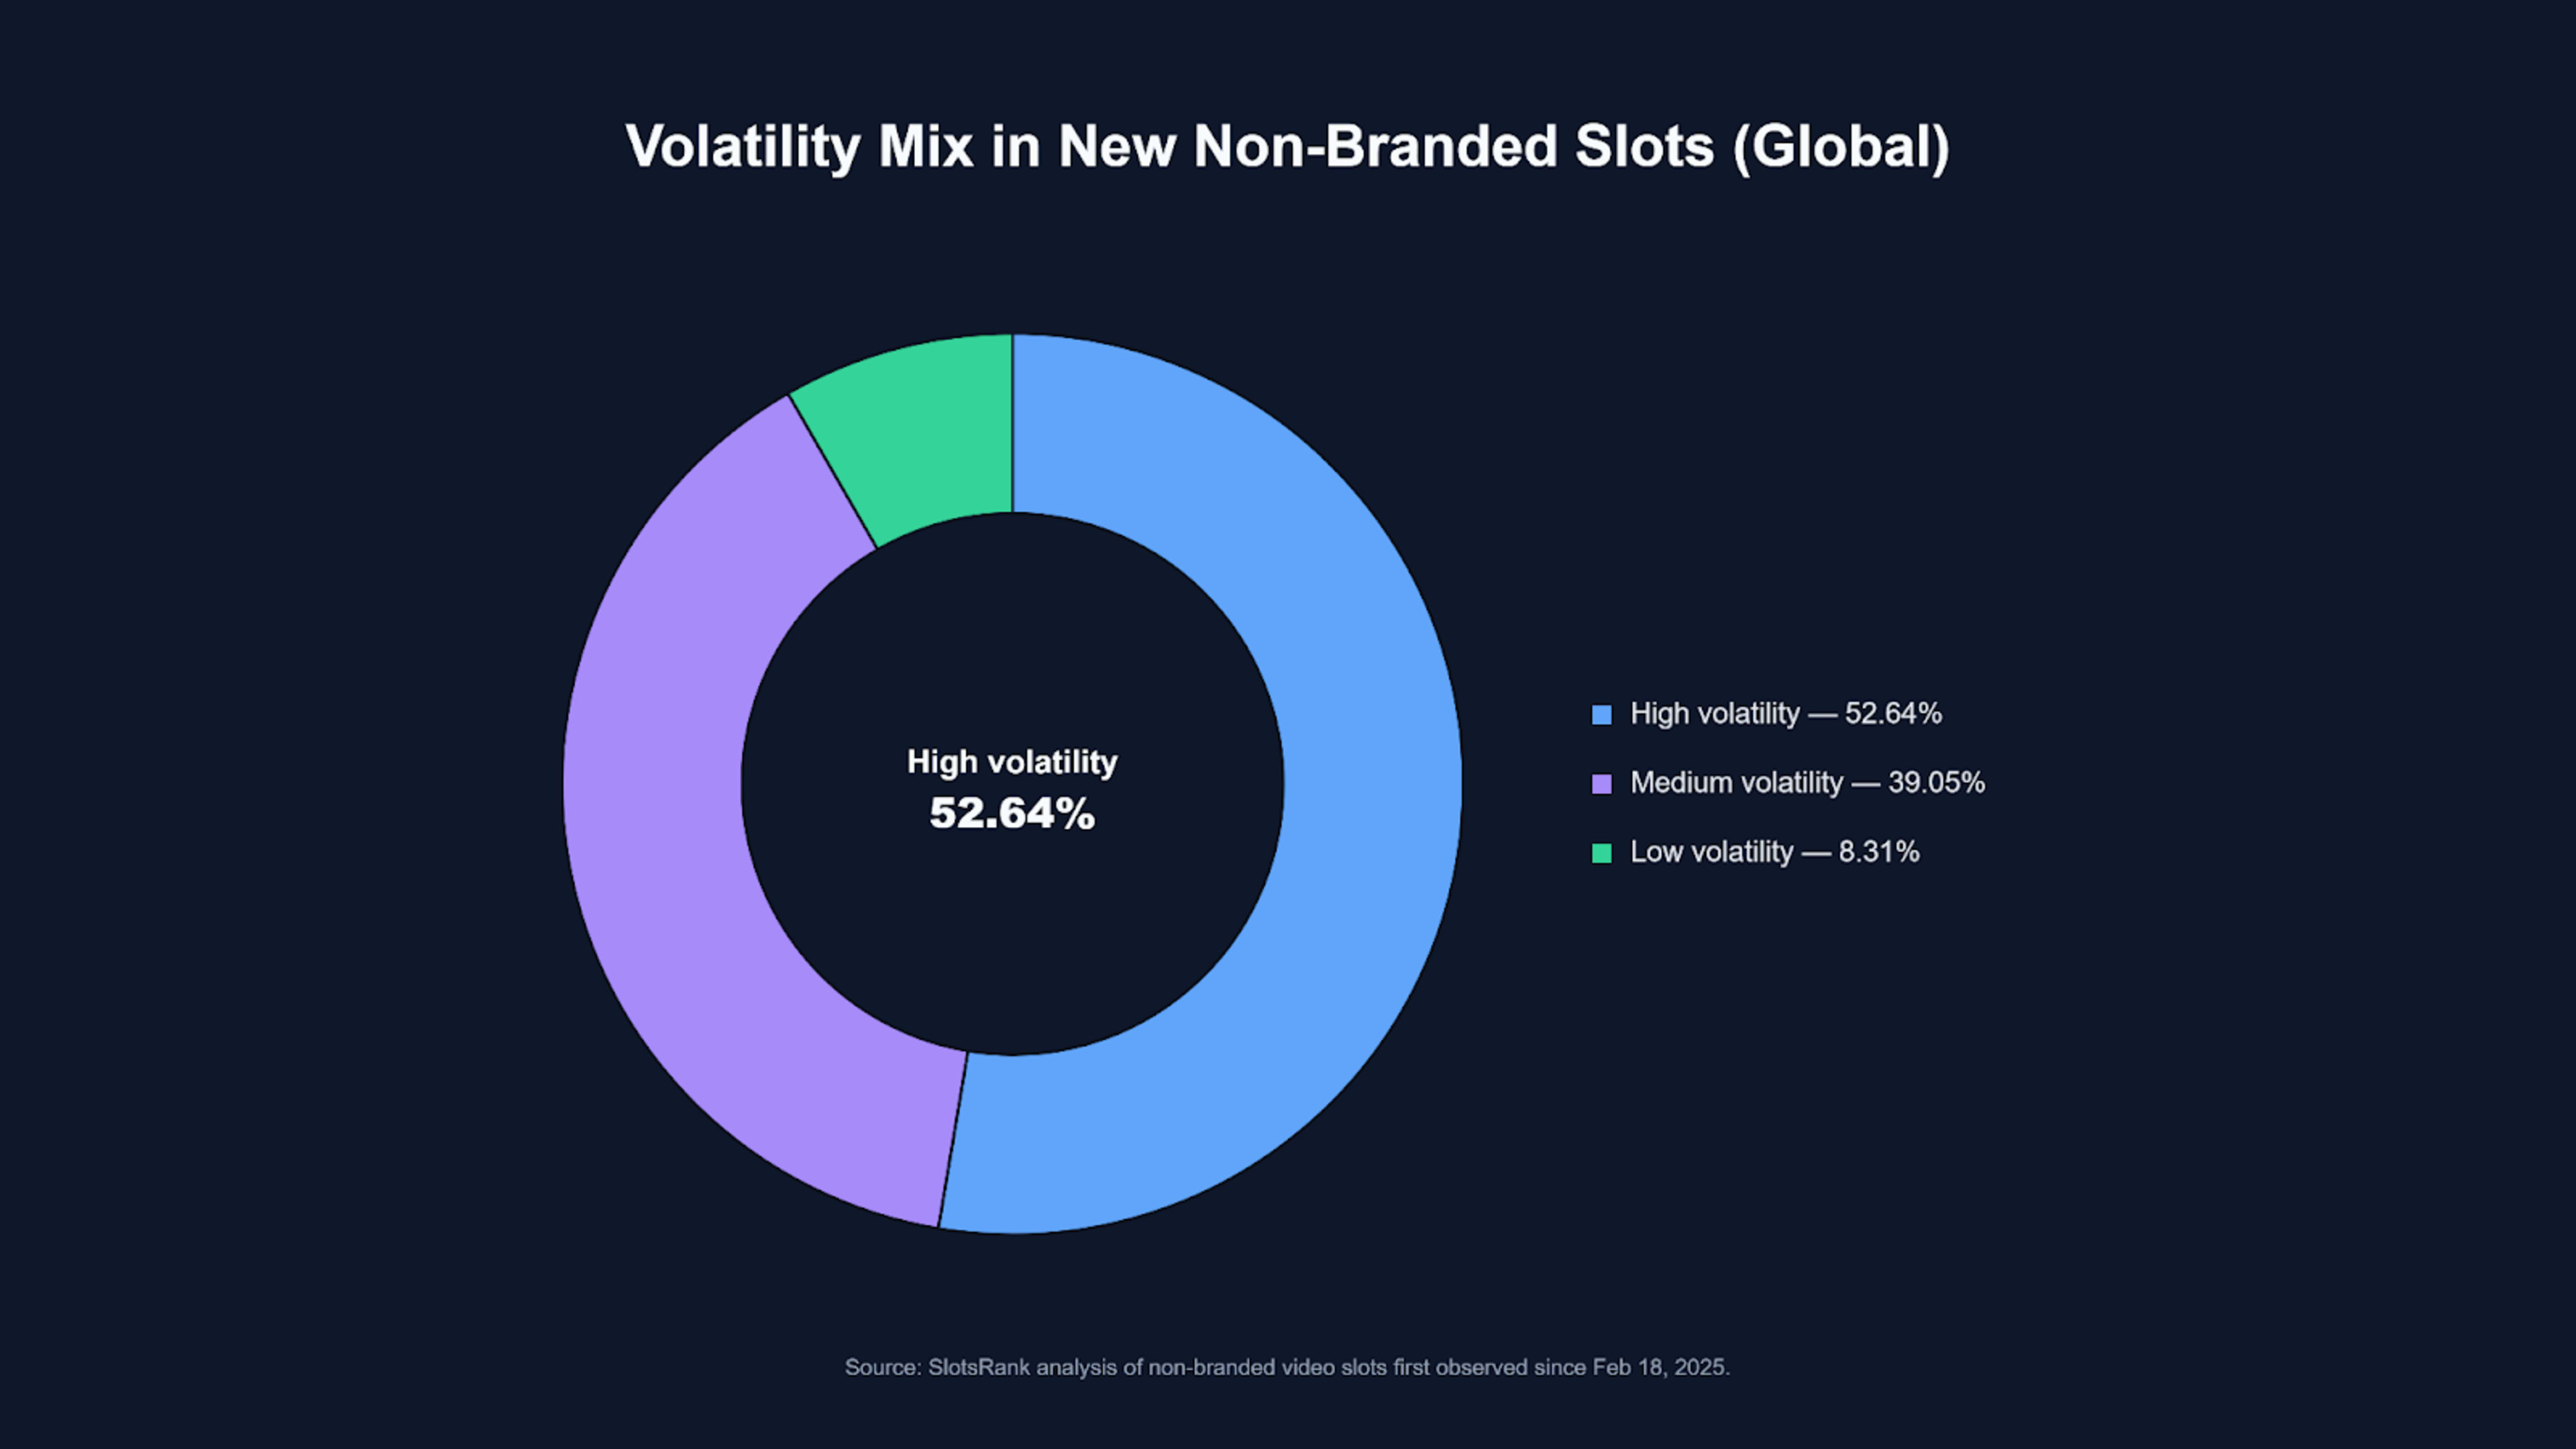
Across our global snapshot of newly observed non-branded slots, the volatility mix leans decisively higher:
- High volatility: 52.64%
- Medium volatility: 39.05%
- Low volatility: 8.31%
This distribution is significant because volatility often aligns with the same extreme tail as maximum exposure. While the relationship is not exact, high volatility commonly accompanies higher ceilings, as both reflect a tendency toward wider outcome ranges.
Market snapshots confirm this pattern: high-volatility titles account for 54.09% in the UK, 53.41% in Sweden, and 55.49% in Brazil. While the proportions fluctuate slightly, high volatility remains the dominant profile among new non-branded releases.
RTP High Clusters Around 96%–98%
RTP High indicates how published return settings are distributed in newer releases. It does not reflect individual player outcomes or serve as a measure of quality. Rather, it reveals how closely developers cluster their games around specific return ranges.
In our global snapshot, the median RTP High is 96.10%, and the distribution is heavily concentrated in a narrow band:
- Below 94%: 7.71%
- 94% to under 96%: 35.54%
- 96% to under 98%: 56.24%
- 98% and above: 0.50%
In practice, most recent non-branded titles are designed within a narrow RTP High band, with the majority falling between 96% and under 98%. Extremely high or sub-94% values are uncommon and account for only a small portion of the market.
It is important to note that RTP settings may vary by jurisdiction and operator, so the same title may have different returns across markets. Despite this variability, the clustering pattern shows that developers consistently converge around a familiar RTP High range, rather than distributing designs evenly across the spectrum.
Reels and Lines Show Two Design Tracks
Basic structural elements—reel count and number of lines—provide clear insight into how new slots are constructed, even before considering themes or feature mechanics.
At a global level, the most common configuration is still the familiar one:
- Five reels remain the most prevalent configuration among the titles analyzed.
Line formats, however, show a clear split between classic layouts and high-line structures. Globally, the line distribution looks like this:
- ≤25 lines: 58.55%
- 26–50 lines: ~14%
- 51–243 lines: ~9%
- 244–999 lines: ~2%
- 1,000+ lines: 16.47%
Classic-line formats continue to dominate, but a significant share of new releases feature very high line counts. Games with 1,000+ lines now represent a notable portion of the market and coexist with the traditional ≤25-line format, rather than supplanting it.
A higher line count does not guarantee better odds, higher RTP, or an improved player experience. Instead, it reflects a different design approach: high-line titles are structured to alter the frequency and presentation of outcomes. The market now operates on two parallel tracks—a stable foundation of classic formats and a growing segment of high-line games that broaden the range of slot designs.
Max Bets: Typical Limits vs Outliers
A clean way to see how “accessible” or “extreme” a slot’s configuration can be is to look at maximum bet settings. Most titles cluster around familiar limits, but the long tail is still very real.
| Typical | Extreme tail |
| Median max bet: 100 | Max observed: 3,000 |
| 90th percentile max bet: 250 |
The market accommodates two parallel realities: most new releases are configured with maximum bets within standard ranges, ensuring comparable stake ceilings, while a smaller subset features significantly higher maximum bets, pushing the upper boundary for single-spin stakes.
Stake ceilings, like maximum exposure and volatility, define the outer limits of slot configuration rather than outcomes or performance. Although most releases appear typical, a small number of outliers broaden the market's spectrum of risk profiles and stake ceilings.
Branded Slots: A Small Snapshot, Not the Core
A smaller set of branded titles was reviewed for reference, but these releases are not central to the analysis, which primarily relies on the larger non-branded dataset.
Branded snapshots broaden the scope, showing that high-ceiling design spans both original branded concepts and licensed IP. Examples from our review include “Donny And Danny” (Hacksaw Games), “Regal Knights” (Push Gaming), and Monopoly titles from Red Tiger and NetEnt. These findings underscore the ongoing presence of recognizable IP in the slot market.
The main takeaway is limited: branded titles exhibit varied ceiling profiles, but the branded sample should be viewed as a supplementary perspective rather than a foundation for broad market conclusions. Accordingly, we refrain from comparisons regarding volatility or branded performance.